Evercode™ Whole Transcriptome v4
/in Evercode, Parse, Partners, Seminar/by Harshita SharmaEvercode™ Whole Transcriptome v4 from Parse Biosciences delivers higher sensitivity single cell transcriptomics with a streamlined, instrument-free workflow built for labs ready to scale.
Detect More Biology from Every Cell — Without Adding Instruments to Your Bench
Single cell RNA sequencing has transformed how we interrogate complex tissues, immune repertoires, and disease biology — but for many labs, the barriers to entry and scale remain real. Instrument dependencies and low cell recovery have limited what’s practically achievable. Evercode™ Whole Transcriptome v4 addresses these constraints directly. Built on Parse Biosciences’ proven combinatorial barcoding chemistry, v4 enhances transcript and gene detection efficiency across sequencing depths, giving you sharper resolution of rare cell populations and lowly expressed genes without requiring specialised hardware.
What makes v4 a meaningful step forward is the combination of improved sensitivity with a redesigned, bead-based workflow. Centrifugation steps have been replaced with magnetic bead clean-up, resulting in up to 75% higher cell retention — a significant gain when working with limited or precious samples. Fewer pipetting steps, greater automation compatibility, and increased confidence at critical handling stages mean your experiments scale more reliably, whether you’re processing a handful of samples or running large cohort studies across conditions and replicates.

Higher Sensitivity, Greater Biological Resolution
Improves transcript detection efficiency at every sequencing depth. Clearer identification of rare cell states and detection of genes.
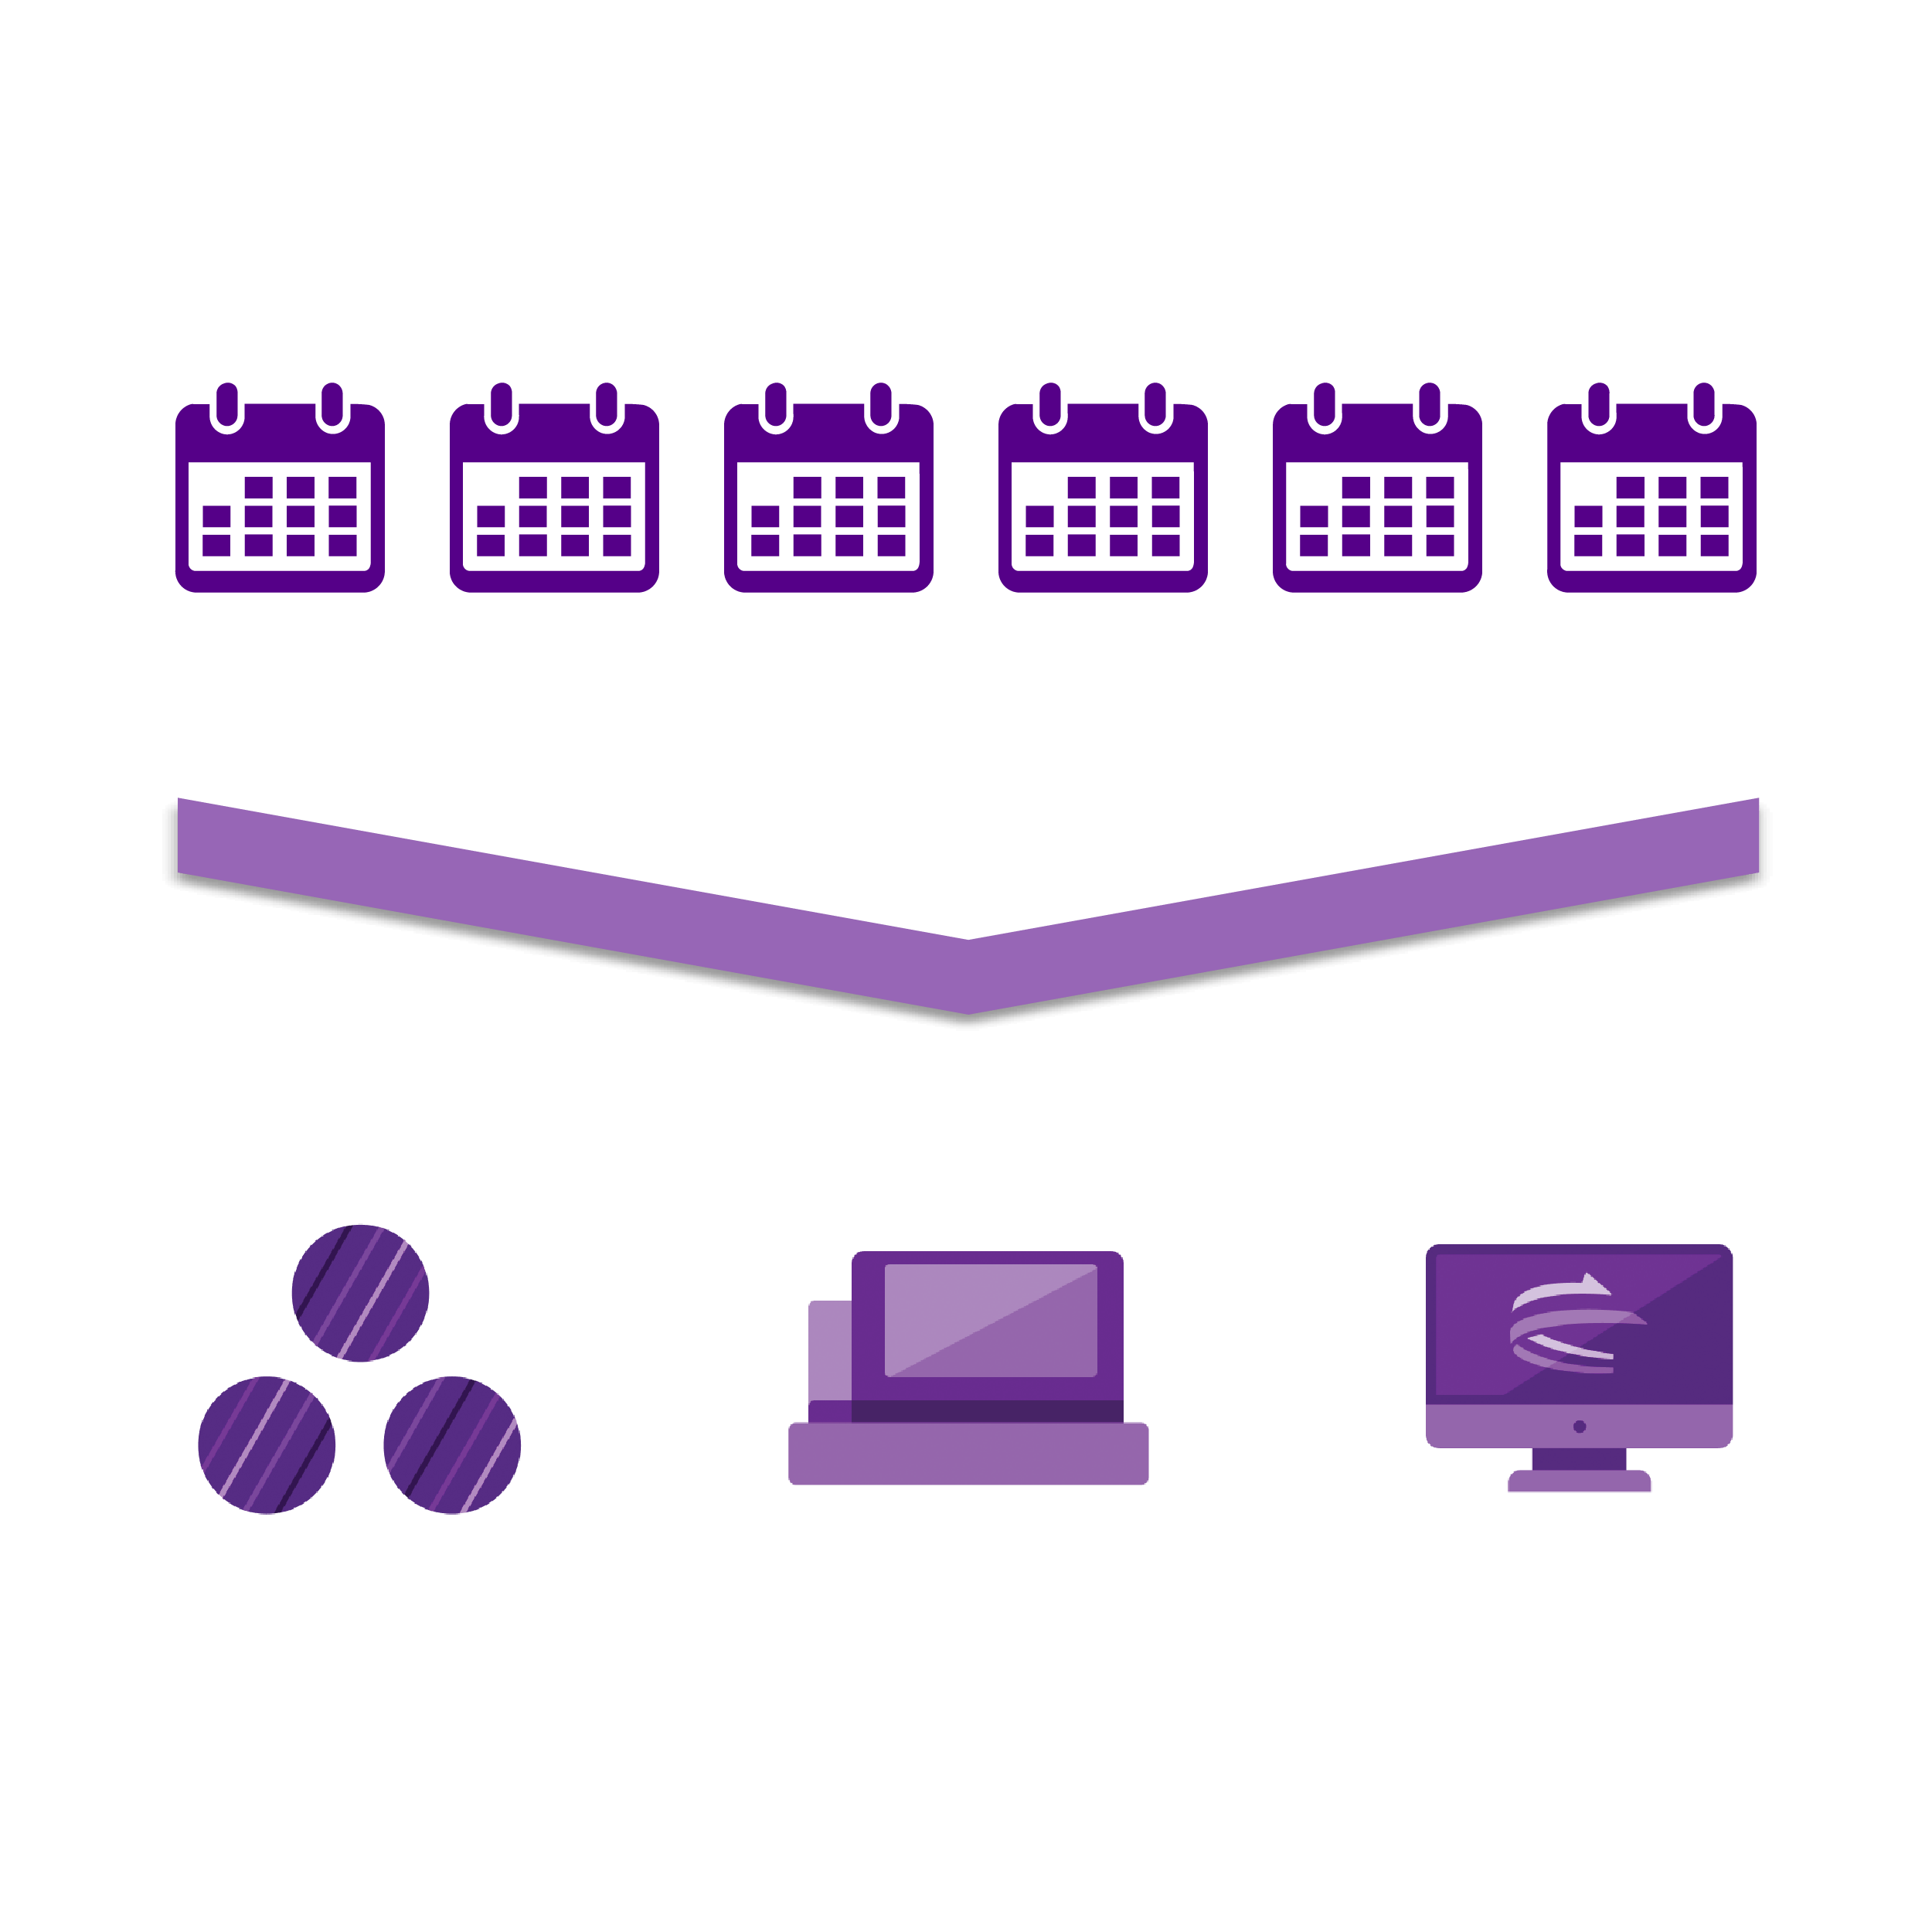
Instrument-Free Scalability
No capital equipment purchase.
No booking time on a shared instrument.
Single cell experiments start with a standard cell or nuclei suspension and a set of reagent plates — nothing more.
Bead-Based Workflow for Higher Cell Recovery
Retaining up to 75% more cells through critical clean-up steps.
Built for Automation and Reproducibility
Highly compatible with liquid handling systems, supporting consistent results across operators and sites.
They talk about the problem they are trying to solve for a researcher, how has the feedback received from customers influenced the evolution of Evercode and more....

Ebru Boslem, PhD
ANZ Market Manager - Research Genomics
Our specialist team can advise on experimental design, sample preparation, and sequencing strategy — reach out to me directly and we can discuss your needs.
1. For Immunology & Oncology Researchers
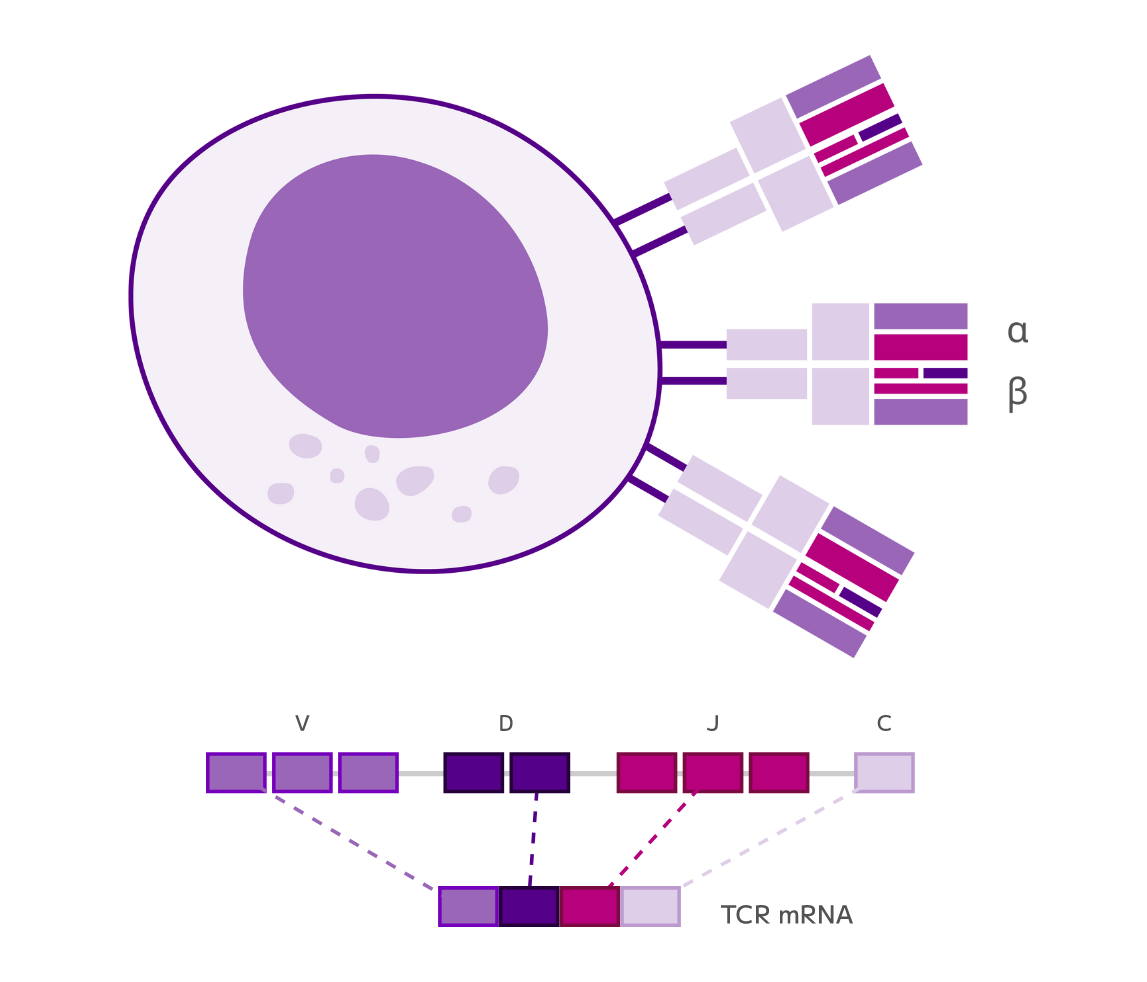
Pair whole transcriptome profiling with Evercode TCR or BCR kits to connect clonotype identity with transcriptional phenotype at single cell resolution.
2. For Oncology & Tumour Biology Labs
Higher gene detection per cell means better characterisation of malignant subpopulations, stromal interactions, and therapy-resistant states — even in samples with limited cell numbers from biopsies or PDX models.
3. For Cardiomyocyte and Complex Tissues Studies
Perfect for large cell types which may clog the microfluidic single cell instruments. Parse combinatorial barcoding occurs in plates inside fixed cell eliminating the need for cell suspension flow that can damage & stress cells.
4. For Core Facilities & Service Labs
v4's automation-ready workflow and consistent performance across operators reduce turnaround times and support diverse project demands without tying up instrument slots.
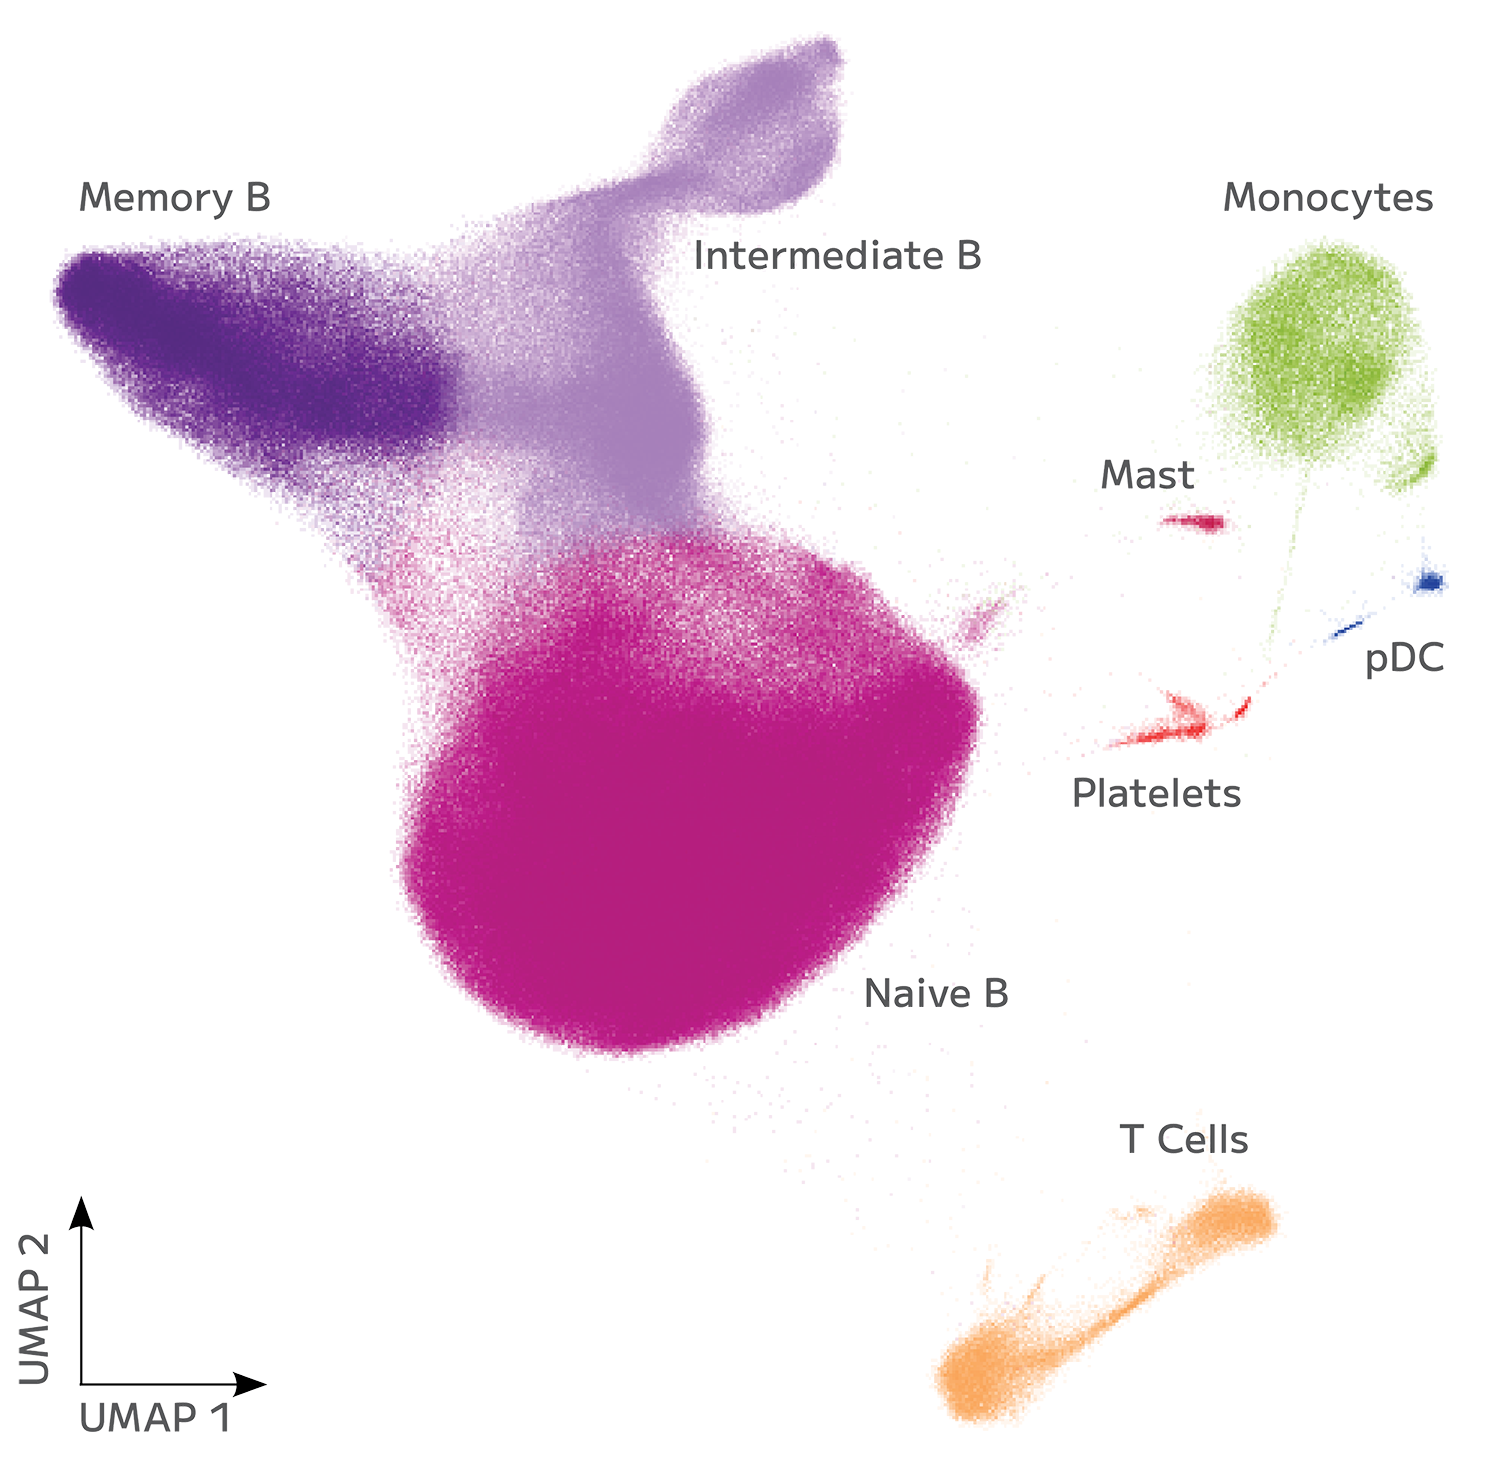
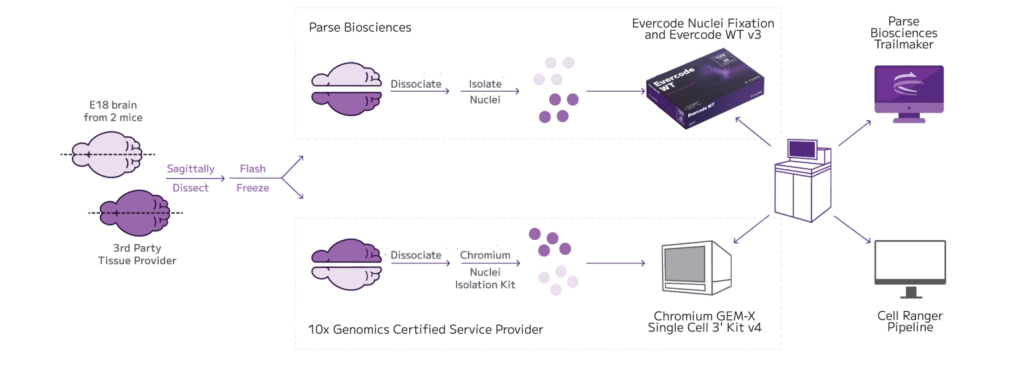
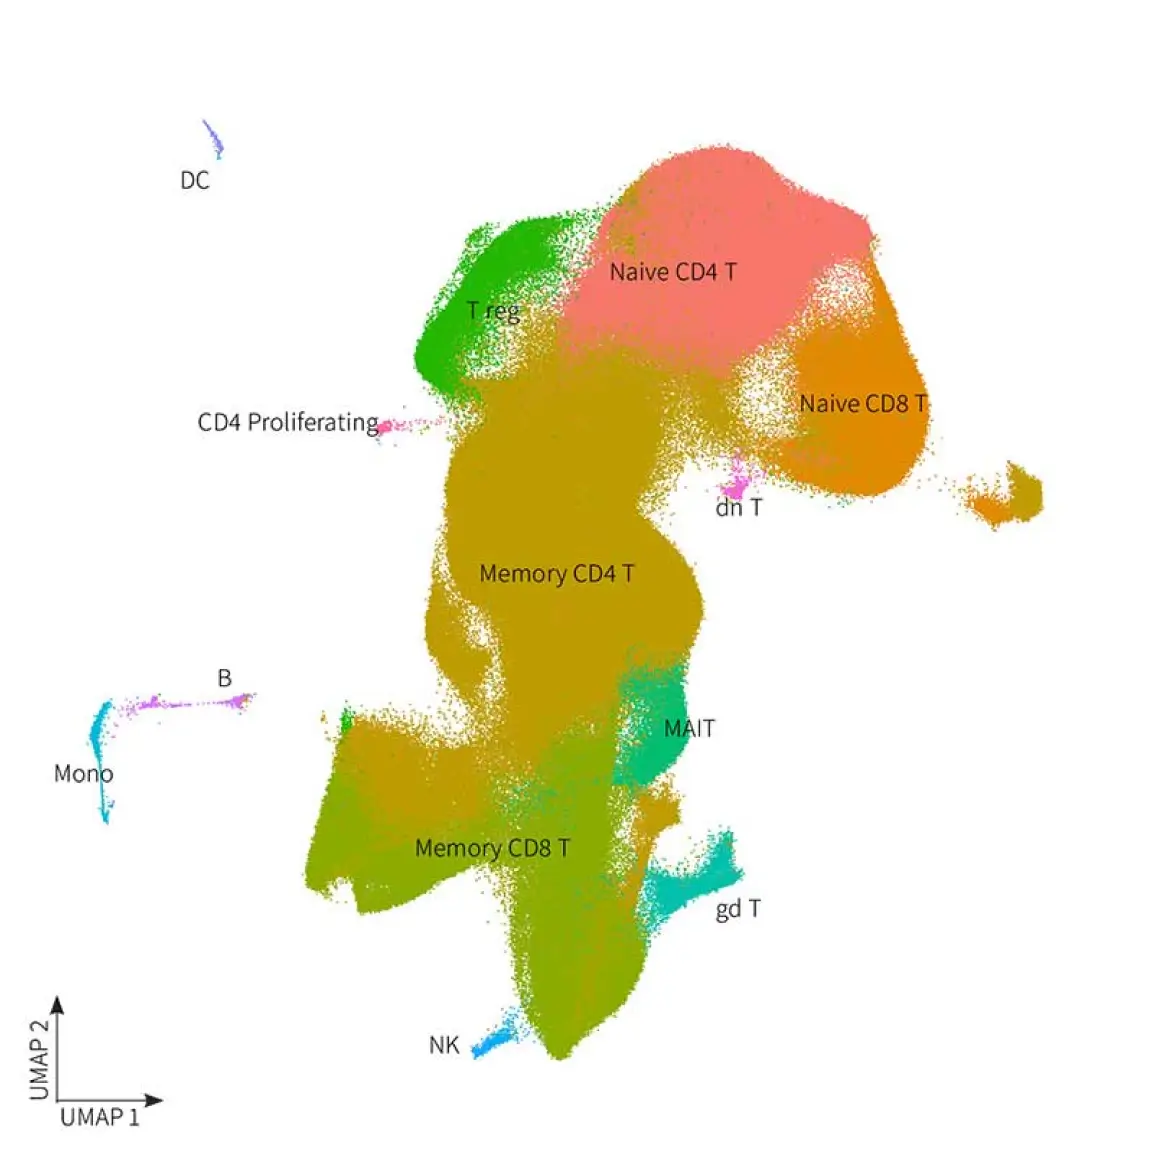
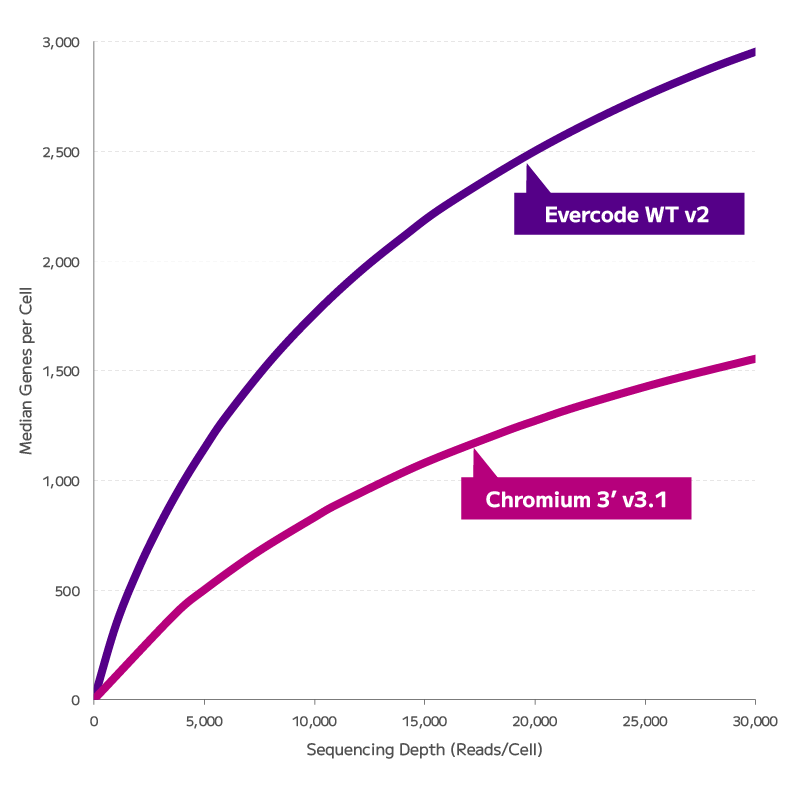
When tested head-to-head using frozen PBMCs from two donors processed in independent labs, Evercode WT v4 demonstrated a clear increase in transcript detection compared to the Chromium GEM-X 3′ platform. Cell type proportions were equivalently represented across both technologies, confirming that Evercode’s combinatorial barcoding approach captures the same biological diversity — with the added advantage of lower ambient RNA contamination and a significant reduction in mitochondrial and ribosomal read content. For labs looking to maximise usable data per read, that’s sequencing budget going directly toward biology rather than noise.
Download Tech Note
Instantly!
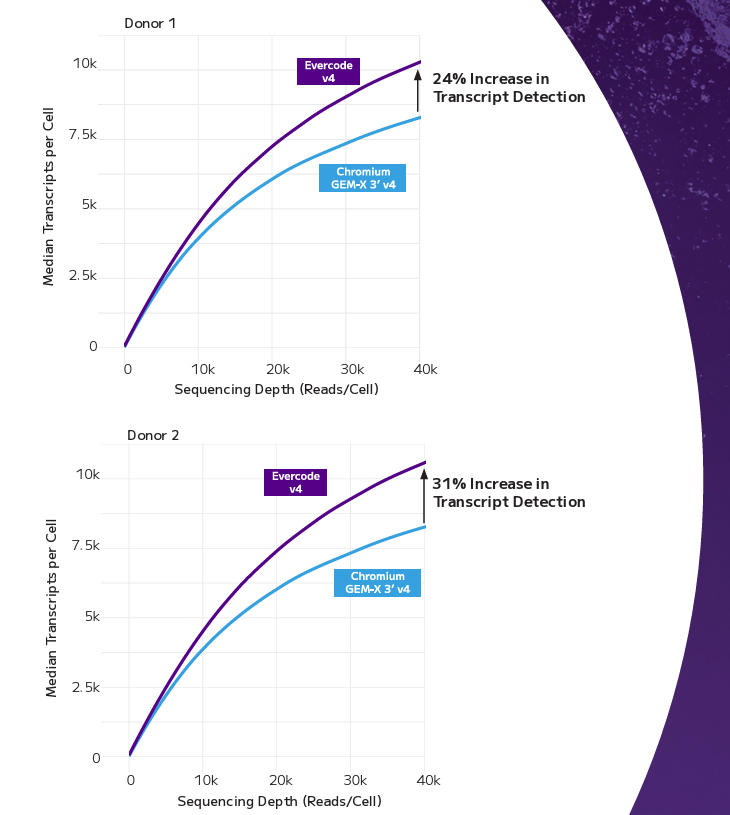
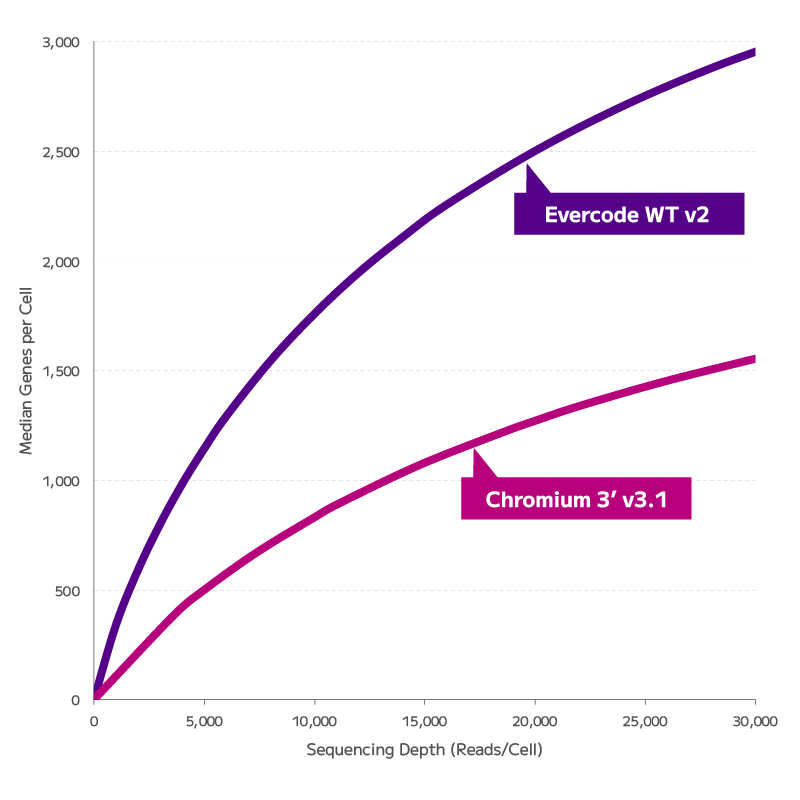
Gene Detection. Median genes detected per cell across different sequencing depths for PBMC donor 1 (top) and PBMC donor 2 (bottom). Aliquots derived from the same donor cryovial lot were distributed to separate laboratories for processing with either Evercode WT v4 or Chromium GEM-X 3’ v4 workflows and analyzed using their respective data analysis pipelines.
In a parallel comparison using fixed PBMCs, Evercode WT v4 retained over four times the number of cells through processing and detected more than 60% higher median transcripts per cell — including diverse RNA biotypes that probe-based approaches can miss entirely. Because Evercode uses an RT-based method rather than predefined probe panels, you’re not limited to a curated gene list; you capture the full transcriptional landscape of each cell. For researchers working with fixed clinical samples or multi-site collections, this means more cells, more genes, and more confidence in what the data is telling you.
Download Tech Note
Instantly!
Detected Transcripts and RNA Biotypes Comparison. Total transcripts detected in human PBMCs across sequencing depths, including protein-coding genes and other RNA biotypes. Other biotypes comprise lncRNA, miRNA, snRNA, snoRNA, miscRNA, pseudogenes, and Ig/TCR genes.
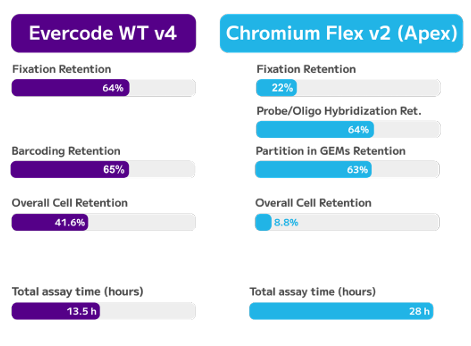
Cell Retention & Assay Time. Overall retention rates were calculated by multiplying stepwise retention across all samples, and total assay times were based on vendor recommendations for four PBMC aliquots.
Evercode™ Whole Transcriptome Range
Evercode WT Mini — Ideal for pilot studies and labs getting started with single cell. Profile up to 10,000 cells per sample.
Evercode WT — The standard configuration for most single cell transcriptomics experiments.
Evercode WT Mega — Designed for larger experiments requiring higher cell throughput per run.
Evercode WT Penta — Maximum scale for ambitious, multi-sample study designs.
Immune Profiling
Evercode TCR — Paired T cell receptor sequencing with whole transcriptome at single cell resolution.
Evercode BCR — Paired B cell receptor sequencing with whole transcriptome at single cell resolution.
Additional Capabilities
Evercode Fixation — Fix samples at the point of collection and process later — ideal for clinical workflows and multi-site studies.
Gene Select — Targeted gene panels to reduce sequencing costs while retaining biological insight.
CRISPR Detect — Single cell readouts for pooled CRISPR screening experiments.
Our team is one form away.
We only need below information to serve you better. Decode Science respects your privacy and will never spam you with unrelated content.